Data visualization with MapLibre
The Austrian Education Ministry internally scores schools using the SÖL-Index, which estimates the socio-economic baseline of schools. It classifies schools into six categories: very low (1), low (2), balanced (3), high (4), very high (5), and highest (6).
I wanted to explore this in a geodata project and build a map that makes regional patterns easier to inspect.
I requested the full SÖL-Index via the Austrian Informationsfreiheitsgesetz process. While I am still waiting for that request, the ministry already published a list of 400 schools in the two lowest categories (1 and 2) for the Chancenbonus program. That dataset is enough for a first map prototype.
At first I experimented with distance-based tiled hexagon grids to visualize which areas affected the schools, but that did not fit the data reliably. So I looked at real-world divisions of the area and first at school districts (Schulsprengel), which would have made a naturally good candidate.
But those districts did not reliably explain what I saw in the data and also were way to coarse. Dozens of schools were falling into different categories despite sharing the same school district. Since these districts are also a matter of each municipality, they would have been way too inhomogeneous in size and demographic makeup to sensibly compare them with each other. Not to mention that sourcing the data on them would have been impossible, given the over 2000 municipalities responsible for them.
Eventually I discovered "Zählsprengel" (ZSP), which is the smallest standardized geographic unit used for official data collection. The system is created and maintained by Statistik Austria.
While not officially confirmed, these are the most likely candidates for the basis of the Index. In the data, schools still share ZSPs with different scoring, so while the scoring is fed by the statistical data of the ZSPs (maybe via an actual lookup of which pupil from which ZSP attends the school in question), I am, until my Informationsfreiheitsgesetz request is processed, resigned to guessing.
Nevertheless, I thought that ZSP was still the right subdivision to display the actual SÖL score on the map.
The Map App
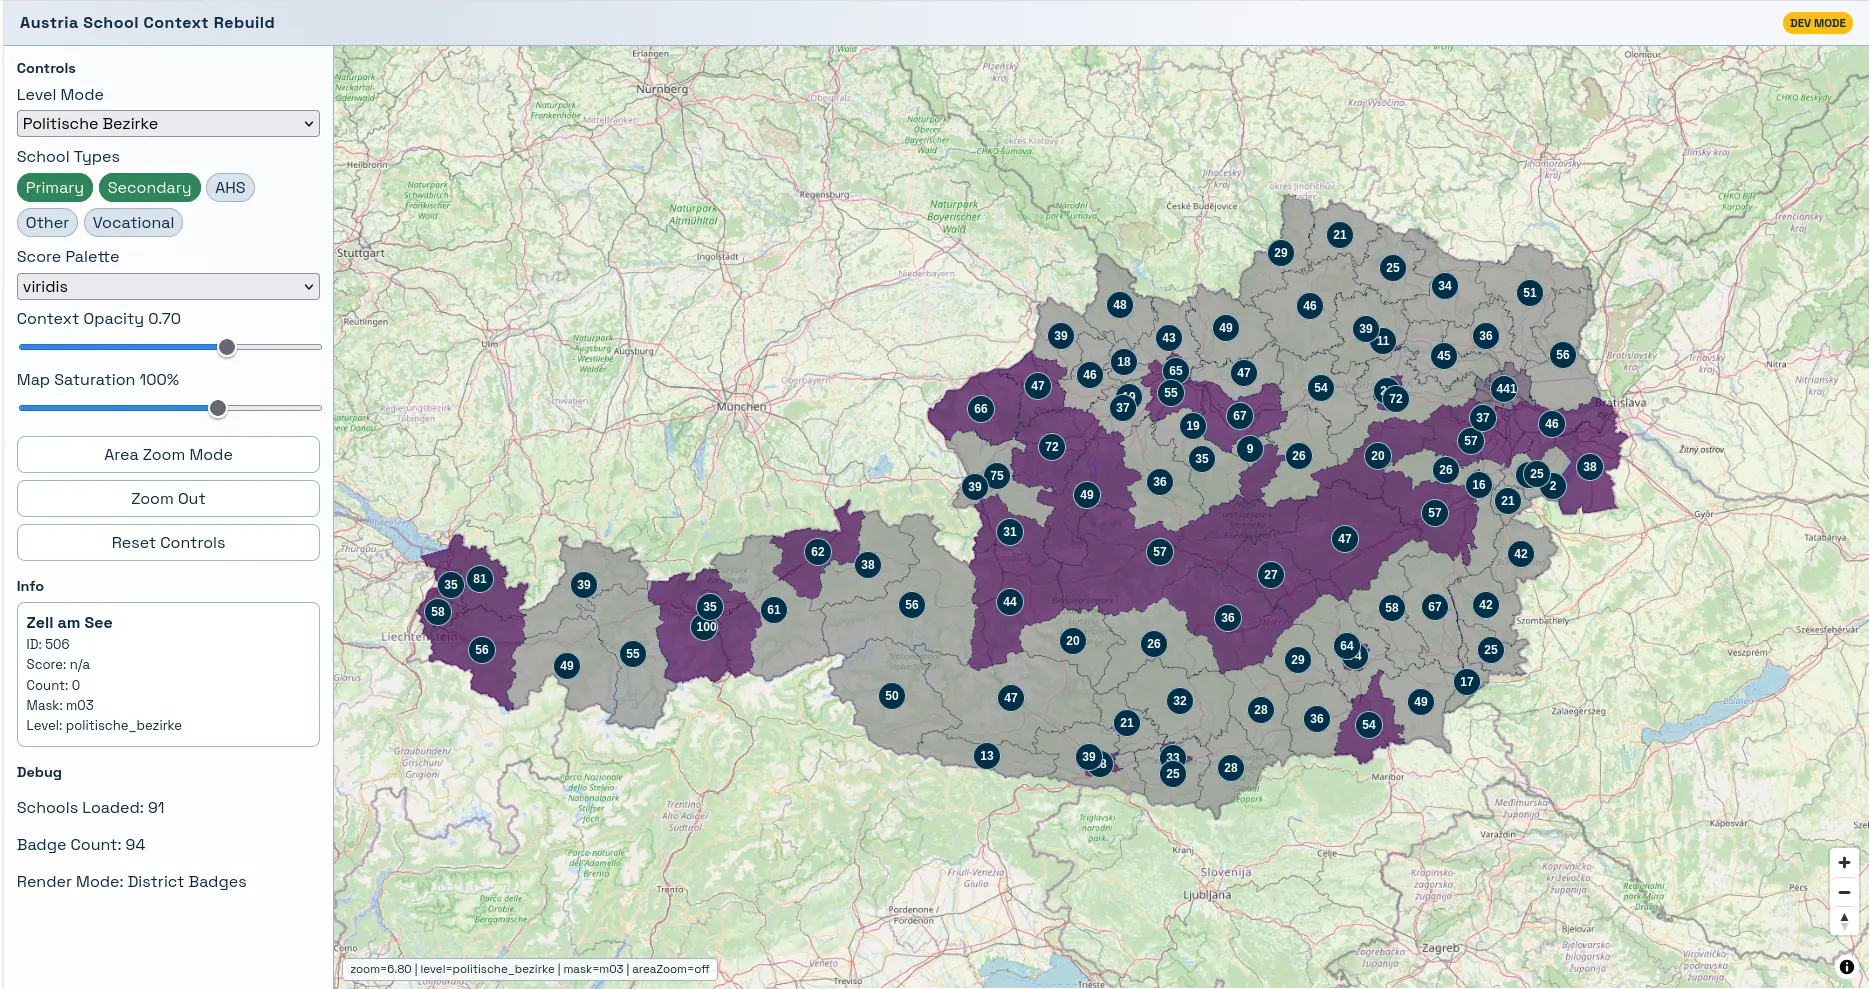
I built an interactive map app to visualize Austrian school data with administrative context.
Core capabilities:
- Administrative layers across Austria:
politische_bezirke(districts)gemeinden(municipalities)zaehlsprengel(census subdivisions)
- Zoom-based layer switching with manual override
- School points at detailed zoom and district badges at broader zoom
- Filters for school types, category masks, and visual settings
- Fast interaction through ETL-precomputed runtime assets
Data Used
Inputs for this version:
- School snapshot database:
data/schools_snapshot_20260316_125447Z.sqlite(all Austrian schools)
- Chancenbonus source:
chancenbonus_schulen_extracted.csv(400 schools with SÖL category 1 or 2)
- Administrative boundaries:
politische_bezirke_2026.geojsongemeinden_2026.geojsonzaehlsprengel_2026.geojson
How I Got the Data
Administrative divisions
Boundary datasets were sourced from Statistik Austria via the INSPIRE Geoportal:
politische_bezirke_2026gemeinden_2026zaehlsprengel_2026
School directory scraping
To build the school directory, I crawled the public Schulen-Online index and exported all 6104 schools into a timestamped SQLite snapshot.
The main challenge is the JSF/MyFaces workflow: no public JSON API, session cookies, and changing hidden state tokens (ViewState) that must be carried between requests.
Pipeline summary:
- Open search page and initialize session.
- Submit an "all schools" search.
- Crawl paginated result pages.
- Open each school detail page.
- Store normalized records in SQLite.
Extracted fields include: SKZ, school title, address, postal code, city, street, public/private status, maintainer, supervisory authority, school type, phone, fax, email, and homepage.
ETL and Scoring Model
Data prep is ETL-first and deterministic.
1. Canonical school model
The ETL reads the latest snapshot and builds canonical records with IDs, type mappings, metadata, and geocoded coordinates.
2. Interim scoring policy
Current scoring is intentionally conservative:
- Schools in
chancenbonus_schulen_extracted.csvget score1.5 - All other schools remain
null(unknown)
This avoids synthetic score assumptions while the full SÖL feed is pending.
3. Precomputed map attributes
For each subdivision feature and active category mask, ETL precomputes:
- counts
- aggregate score fields (where known)
- color-driving attributes
This keeps runtime interaction responsive.
Rendering Stack
Frontend stack:
- Vue 3
- MapLibre GL JS
- Vite
Rendering strategy:
- Subdivisions from vector tiles (
.pbf) - School points loaded as district chunks at detailed zoom
- Pre-aggregated badges at broader zoom